Solving Systems of Equations WebQuest
|
Congratulations! You have finally landed your first part time job. You have decided to use your extra income to buy your very own cell phone. But what kind do you want? In this project, you will work with your group members to research cell phone plans and devices, using what we've learned about systems of equations to find the right plan for you. |

|
You and your group will have two days in class to work on the project. If you are not finished, you will need to complete it during Academic Assist. Your group will need to turn in the following items:
- Email your complete graph to me
- Turn in Cell Phone Project Handout and a print copy of your graph
| Cell Phone Project Handout |
Step 1: What Kind of Plan do you Want?
First you will need to decide what kind of phone plan you want. Click on iPhone or Android and use the tools to decide how many minutes, text and data you want (both sites allow you to select basic plans without data if you don't want a smartphone). You must set the minutes, text and data so that each company has a different price. Record your selections on your handout.
Step 2: What Kind of Phone do you Want?
Research cell phone options from the different companies you selected in Step 1. You will only choose one phone per company from Step 1, but make sure the phone you select matches the plan type. Record your choices on your handout.
Step 3: Write your Equations
On your handout, define your variables and write an algebraic equation for each company from Step 1. Use these equations to create a table of values for each company, showing the cost of ownership for the first year of the cell phone contract.
Step 4: Algebraic Comparison
On your handout, pair your linear equations and use substitution or elimination to solve each system.
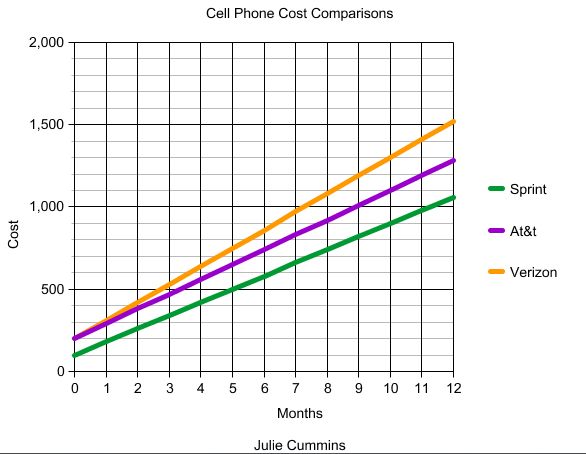
Step 5: Graphic Comparison
Now solve your systems graphically. Go to Create a Graph and click on Line Graph. Follow the directions below.
- Click on the Data tab
- Write a title, x-axis label, y-axis label, and your names for the source
- For the data set, select 13 items and 3 groups
- Use your tables from Step 3 to fill in the tables on the website
- Go to the Preview tab to see your graph
- If you are satisfied with the graph, click on the Print/Save tab. Email a copy to yourself and to [email protected]. Go to Bears Den email and print the copy you sent to yourself.
Step 6: Analyze your Results
Finally, analyze and explain the results of your graphic and algebraic comparisons by answering the questions posed on your handout.
Rubric

Student Samples
|
|
||
